The Workflow History provides a complete log of all workflow executions in your workspace. Use it to audit activity, trace issues, and verify that automated processes ran as expected. By consolidating all workflow executions in one place, the Workflow History provides a clear operational trace of your document-processing activity.Documentation Index
Fetch the complete documentation index at: https://docs.invopop.com/llms.txt
Use this file to discover all available pages before exploring further.
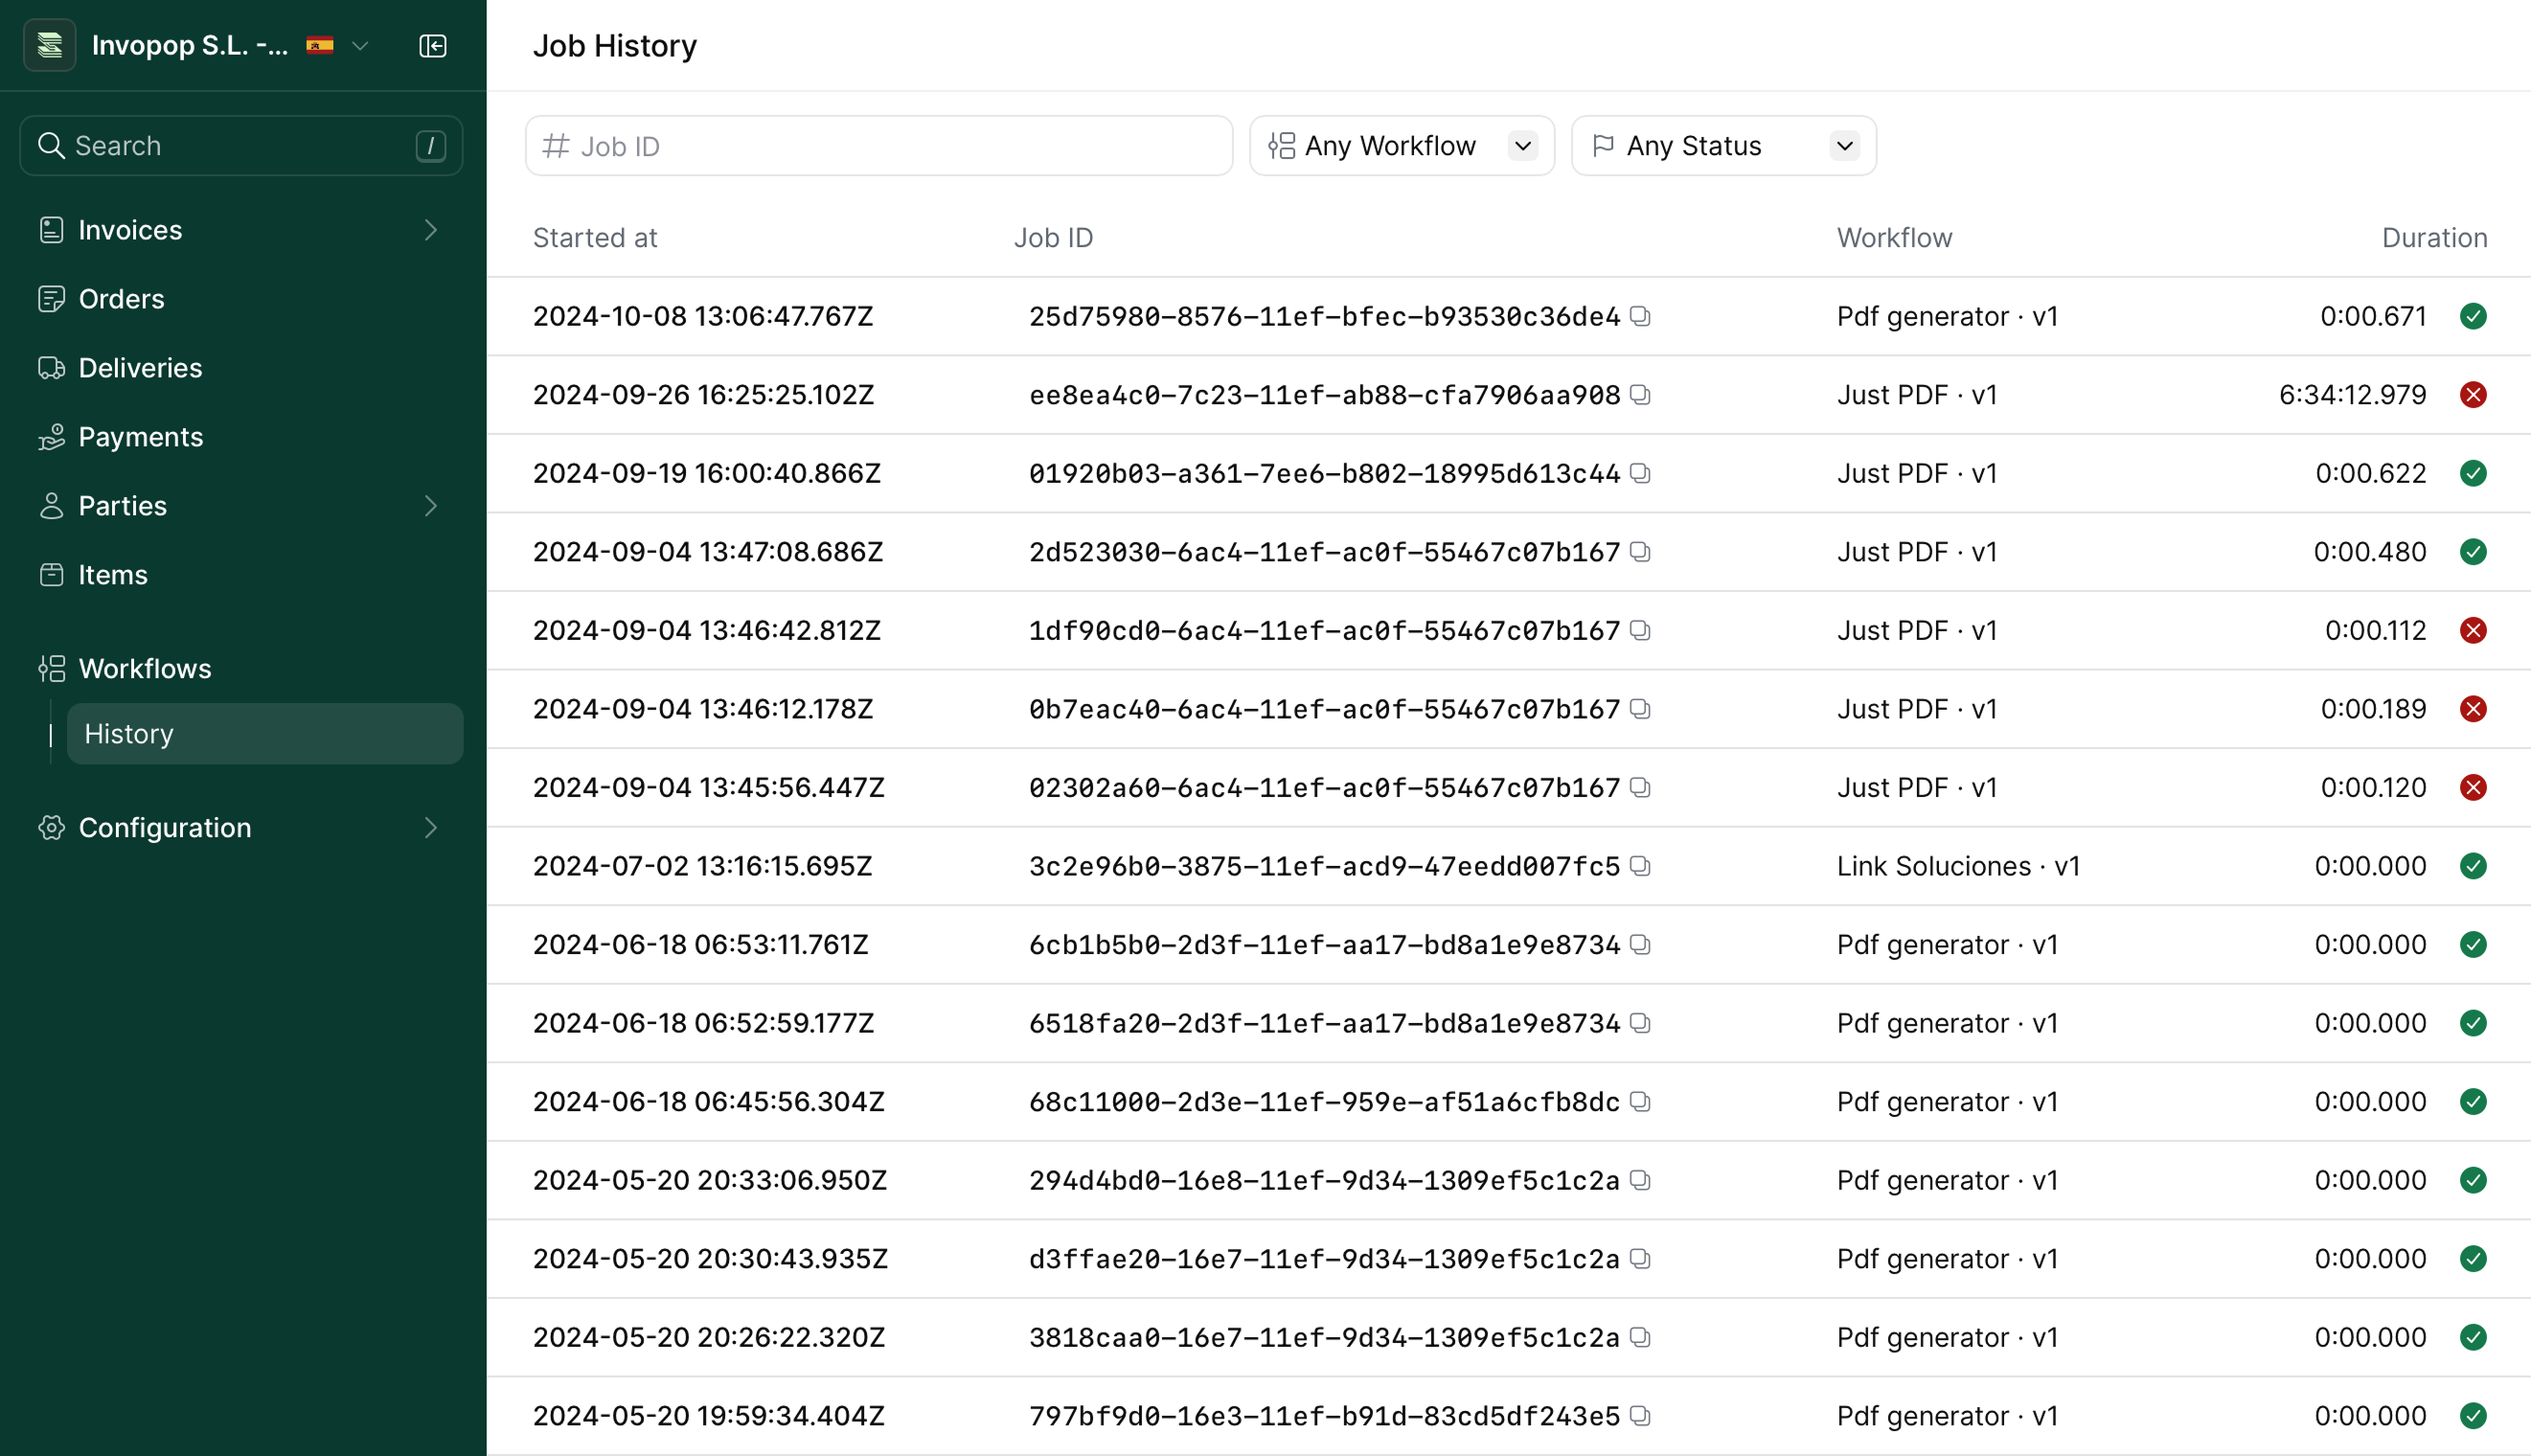
Job history list

- Job ID — Search for a specific job ID
- Workflow — Filter by workflow name
- Status — Display jobs that are running, completed or completed with errors
- Started at — UTC timestamp when the job began.
- Job ID — Unique identifier for the run. Use the copy button to share when reporting issues or cross-referencing logs.
- Workflow — Name and version of the workflow that was executed. This helps distinguish between different automation paths or schema versions.
- Duration — Total time the job took to complete. Short values indicate normal behavior, while longer durations usually indicate long running processes such as waiting for a supplier to register. Our workflow steps have expected durations, and if a step takes longer than expected it will
KOand the job will fail. - Status — Visual indicator showing whether a job is running (yellow), completed successfully (green) or ended with an error (red).
Each job shows the specific workflow version that processed it. This helps you correlate workflow changes with job outcomes. For more information, see Workflow versions.
Job detail
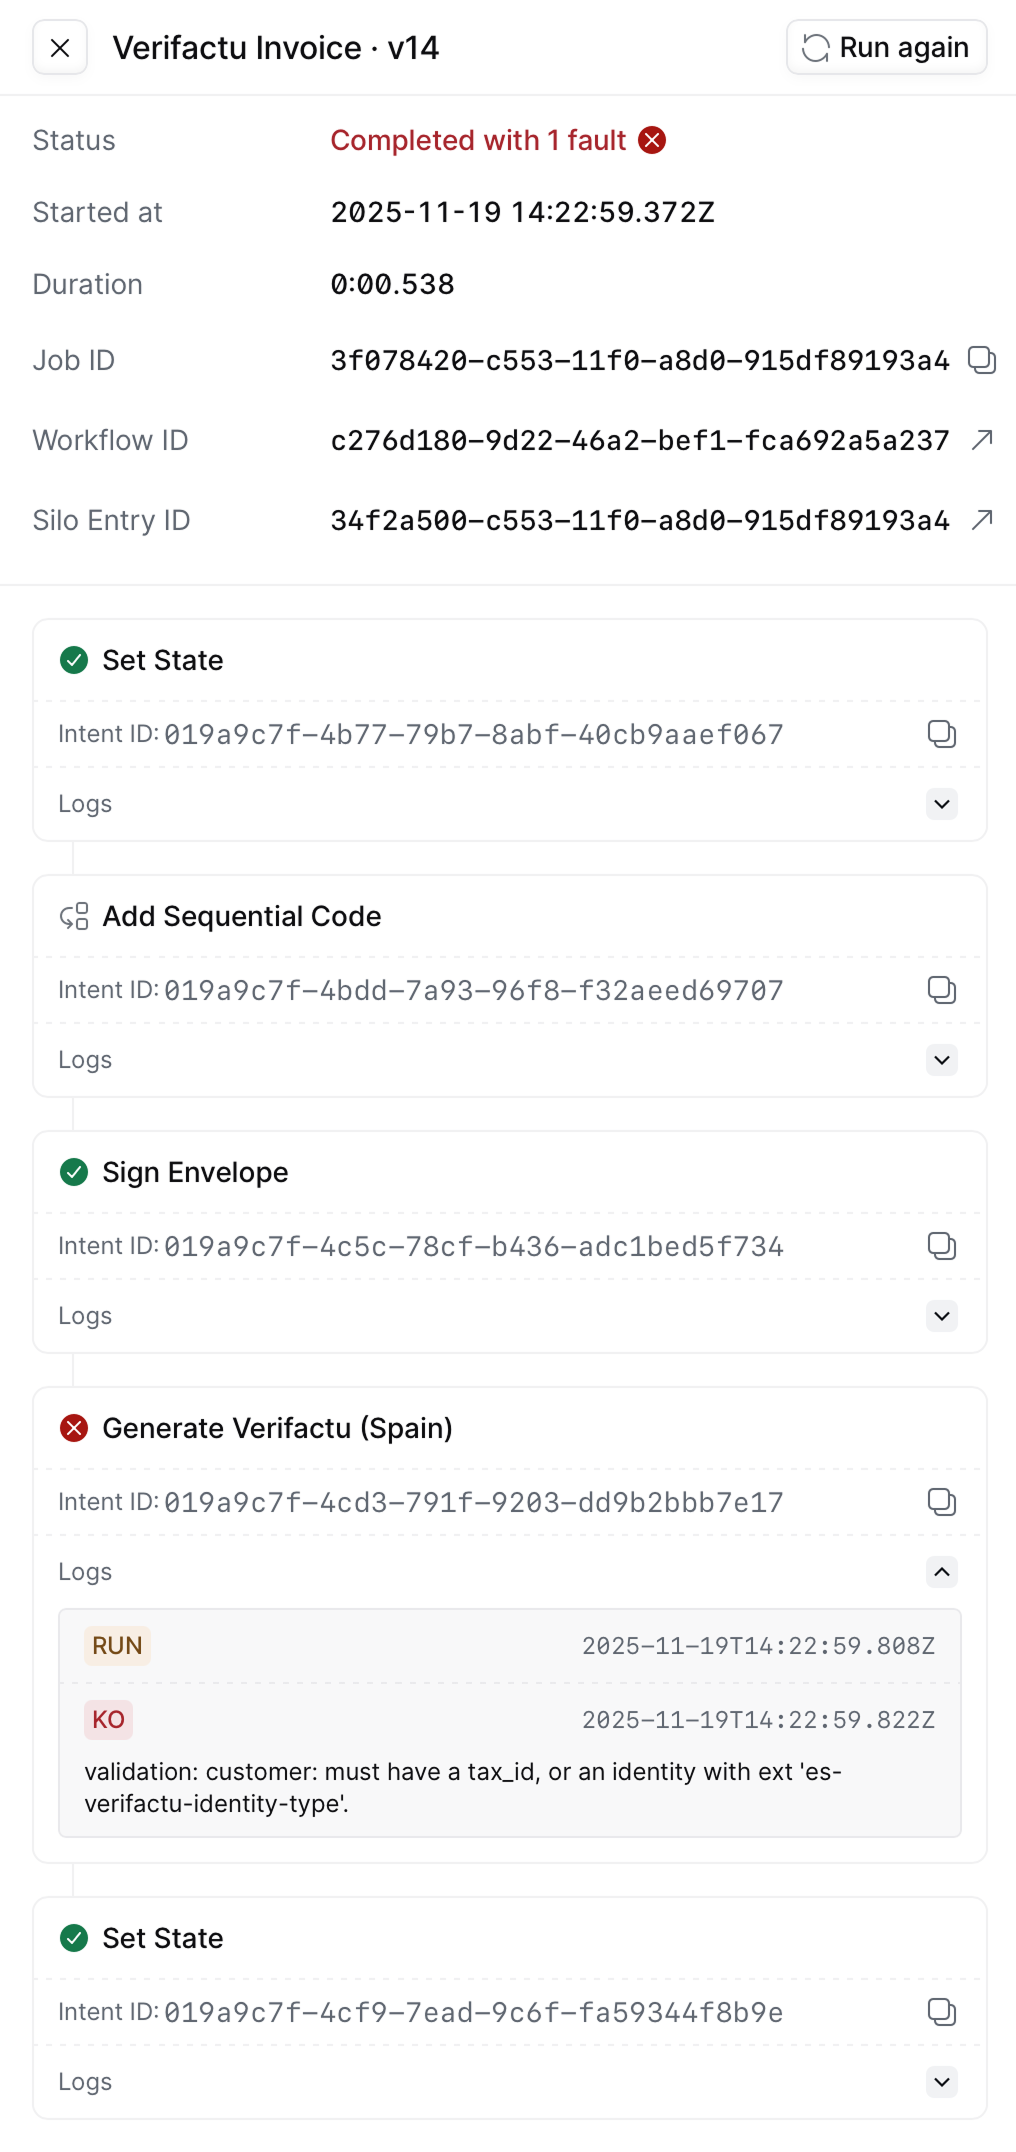
Click any job in the history table to view its execution details. This view provides a step-by-step trace of the workflow run, showing how the workflow progressed, which actions were taken, and where any failures occurred.
Summary information
At the top of the details view, a summary panel displays key metadata:| Field | Description |
|---|---|
| Status | Final outcome of the job run (completed, completed with errors, or failed) |
| Started at | UTC timestamp when execution began |
| Duration | Total processing time |
| Job ID | Unique identifier with a copy button for sharing |
| Workflow ID | Identifier of the workflow definition used. Clicking ↗ will take you to the specific workflow version used to execute this job. |
| Silo Entry ID | Reference to the underlying data record processed by the workflow. Clicking ↗ will take you entry processed with this job. |
Reading the execution trace
Below the summary, each workflow step is listed in execution order. Every step shows:-
Status — Last known status text for this job. Can be one of the following:
RUNattempting to execute the task. QUEUEDprocessor requested more time, job is queued. ERRrecoverable error, can try again. OKjob completed successfully. SKIPnot executed, reason will be stated. KOunrecoverable failure (“knocked out”). - Intent ID — Unique identifier for the step execution
- Log output — Detailed execution logs (expandable for failed steps)
Identifying failures
When a step fails, expand its log output to see:- RUN — When the step started executing
- KO — When the step failed
- Error message — Specific validation errors, API responses, or other failure details
- Missing required fields in the document data
- Validation errors from tax authorities or service providers
- Network or API connectivity problems
- Configuration errors in workflow steps
Fixing issues
After identifying the failure:- Review the error message to understand what’s missing or incorrect
- Check the document data or workflow configuration
- Make the necessary corrections
- Use Run again to test the fix
- Verify the job completes successfully
Related resources
| API Reference | Fetch a job Fetch a job by key |
| Related Guides | Workflows Guide |